Posit Table Contest 2025: Best Pharma Table
rprogramming
dataviz
A 2025 Posit Table Contest entry recognised as The Best Pharma Table, combining gt styling with gridify layouts and synthetic data.
My entry in the 2025 Posit Table Contest was recognised as The Best Pharma Table in Posit’s official results.
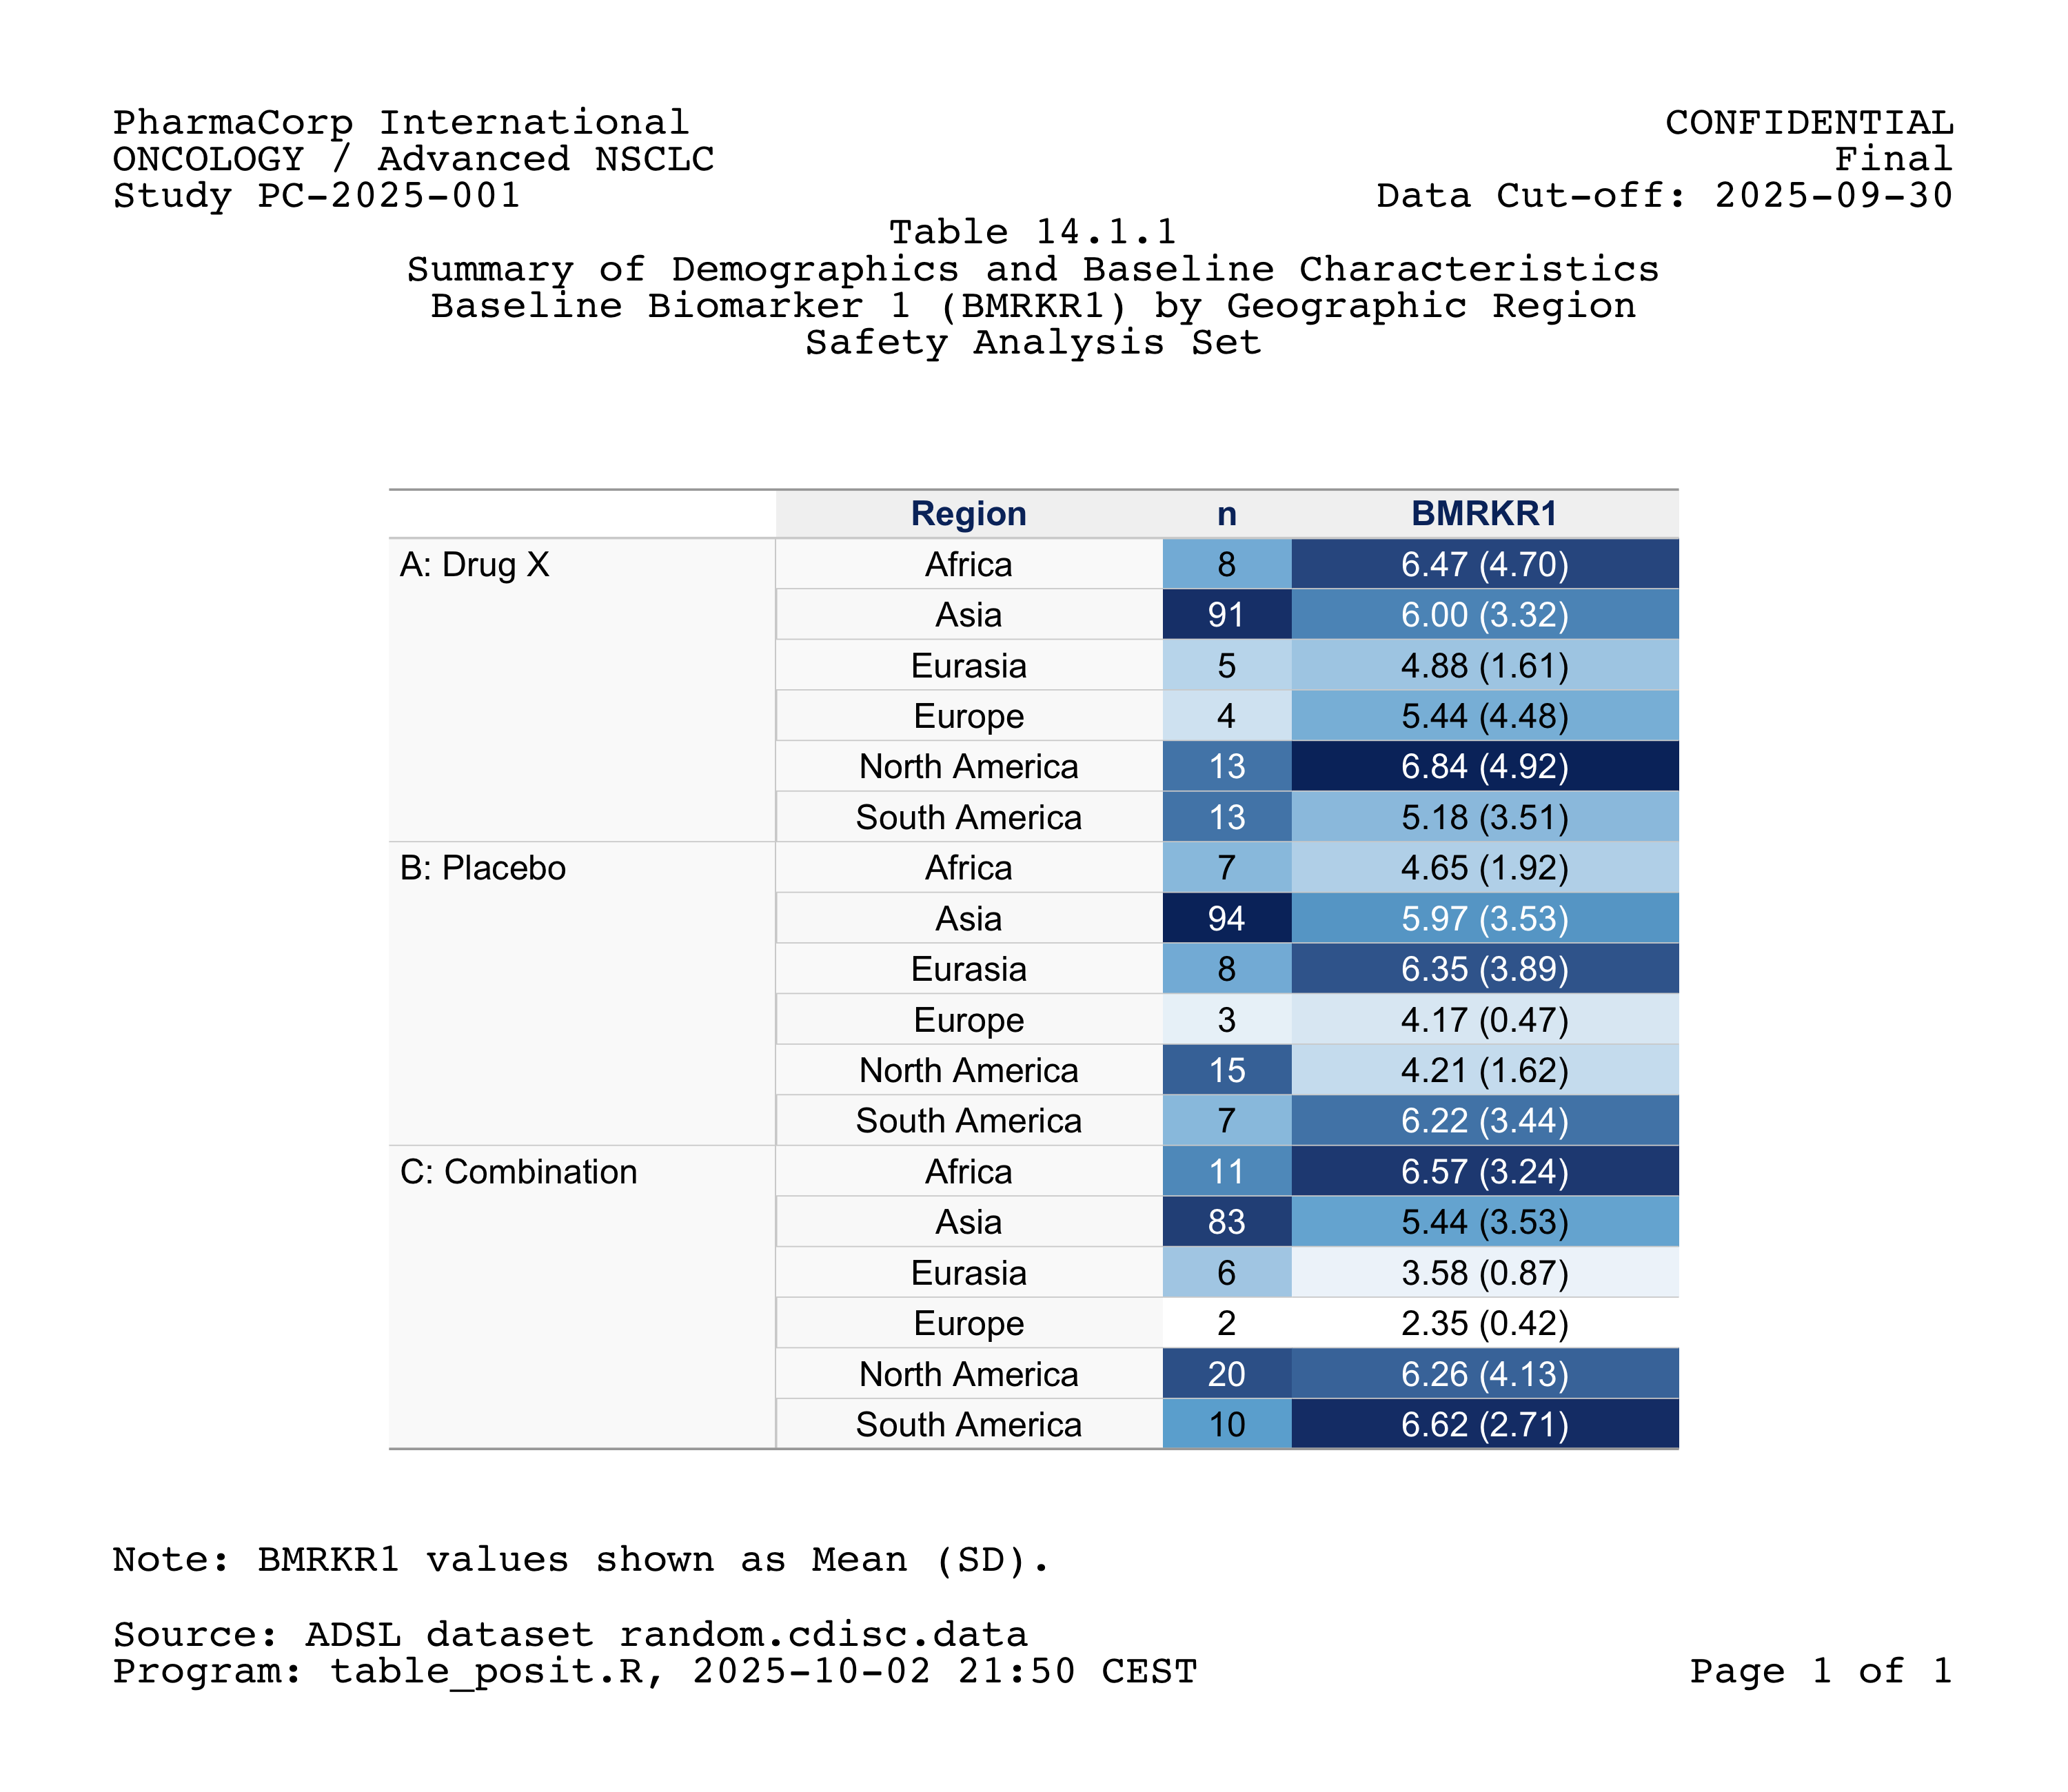
The project combines gt for table styling with gridify for page layout. It demonstrates how a statistical summary, report metadata and presentation can be assembled in one R workflow.
What it demonstrates
- Summarising a synthetic baseline dataset by treatment arm and geographic region.
- Styling counts and biomarker summaries with gt.
- Using gridify to position study information, titles, population labels, footnotes and page metadata around the table.
- Exporting the result as PNG and PDF.
All data, company names and study details in the example are synthetic. This is a reporting demonstration, not a real regulatory submission.
The table